Business KPI Dashboard for Multi-Site Retail and Hospitality (Next.js and PostgreSQL)
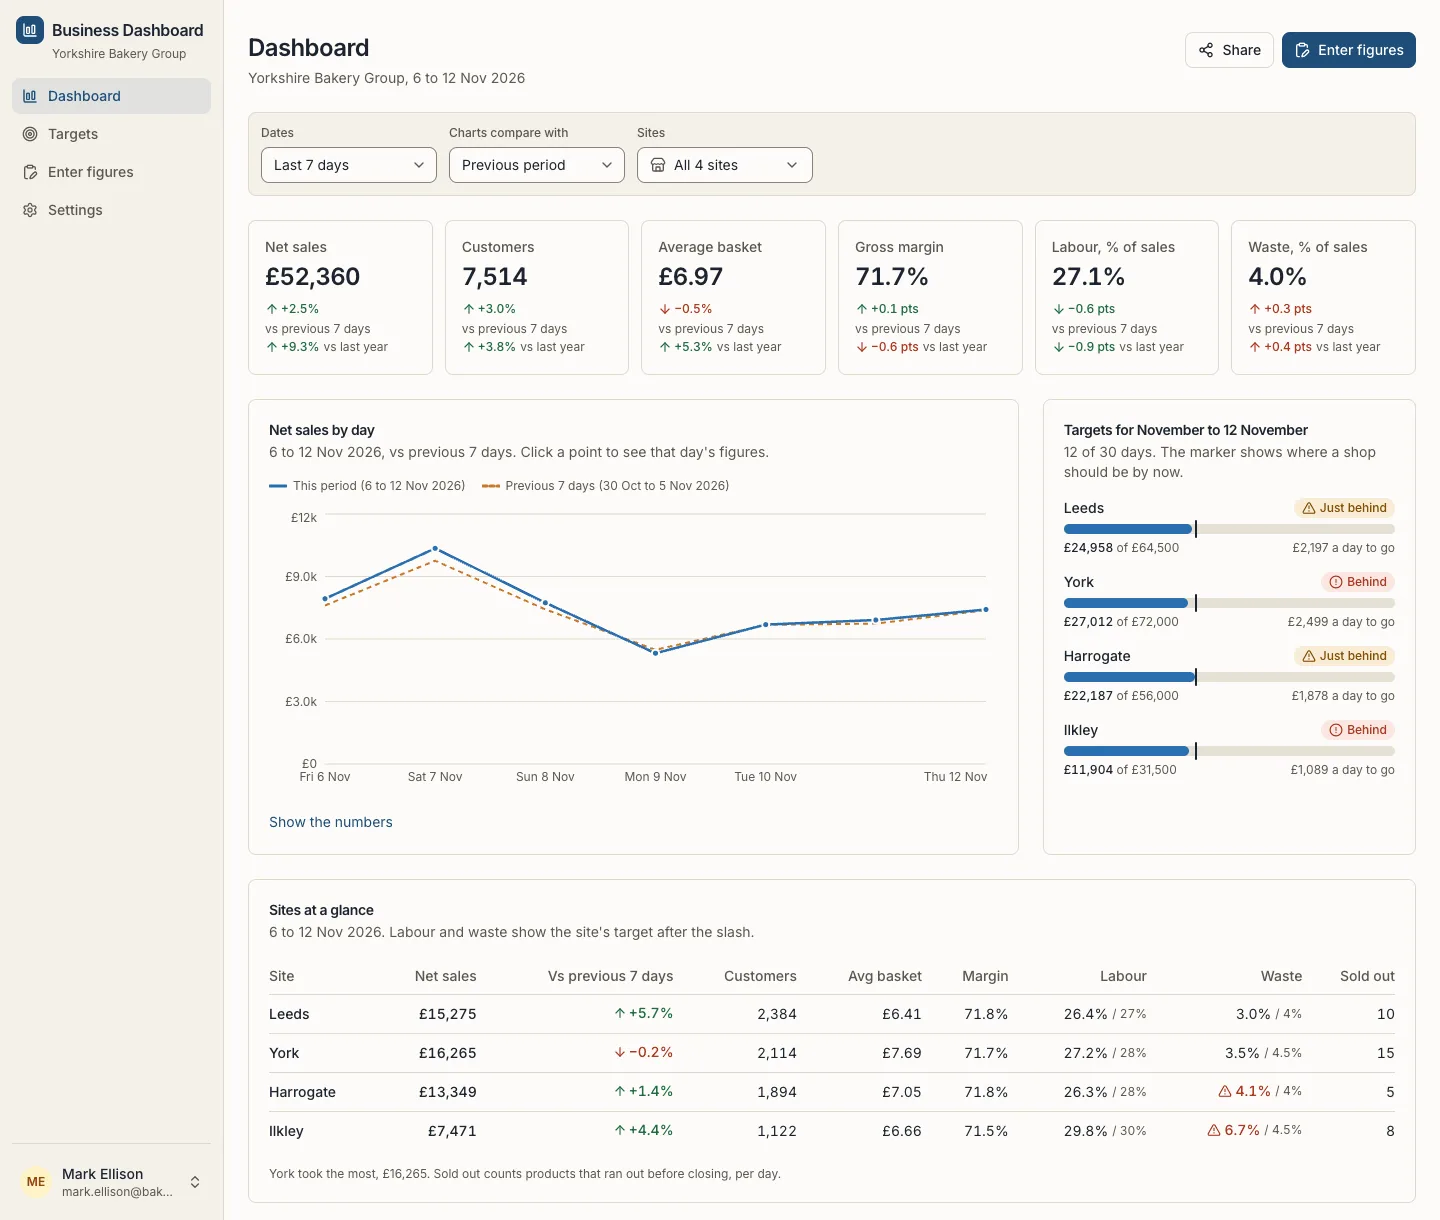
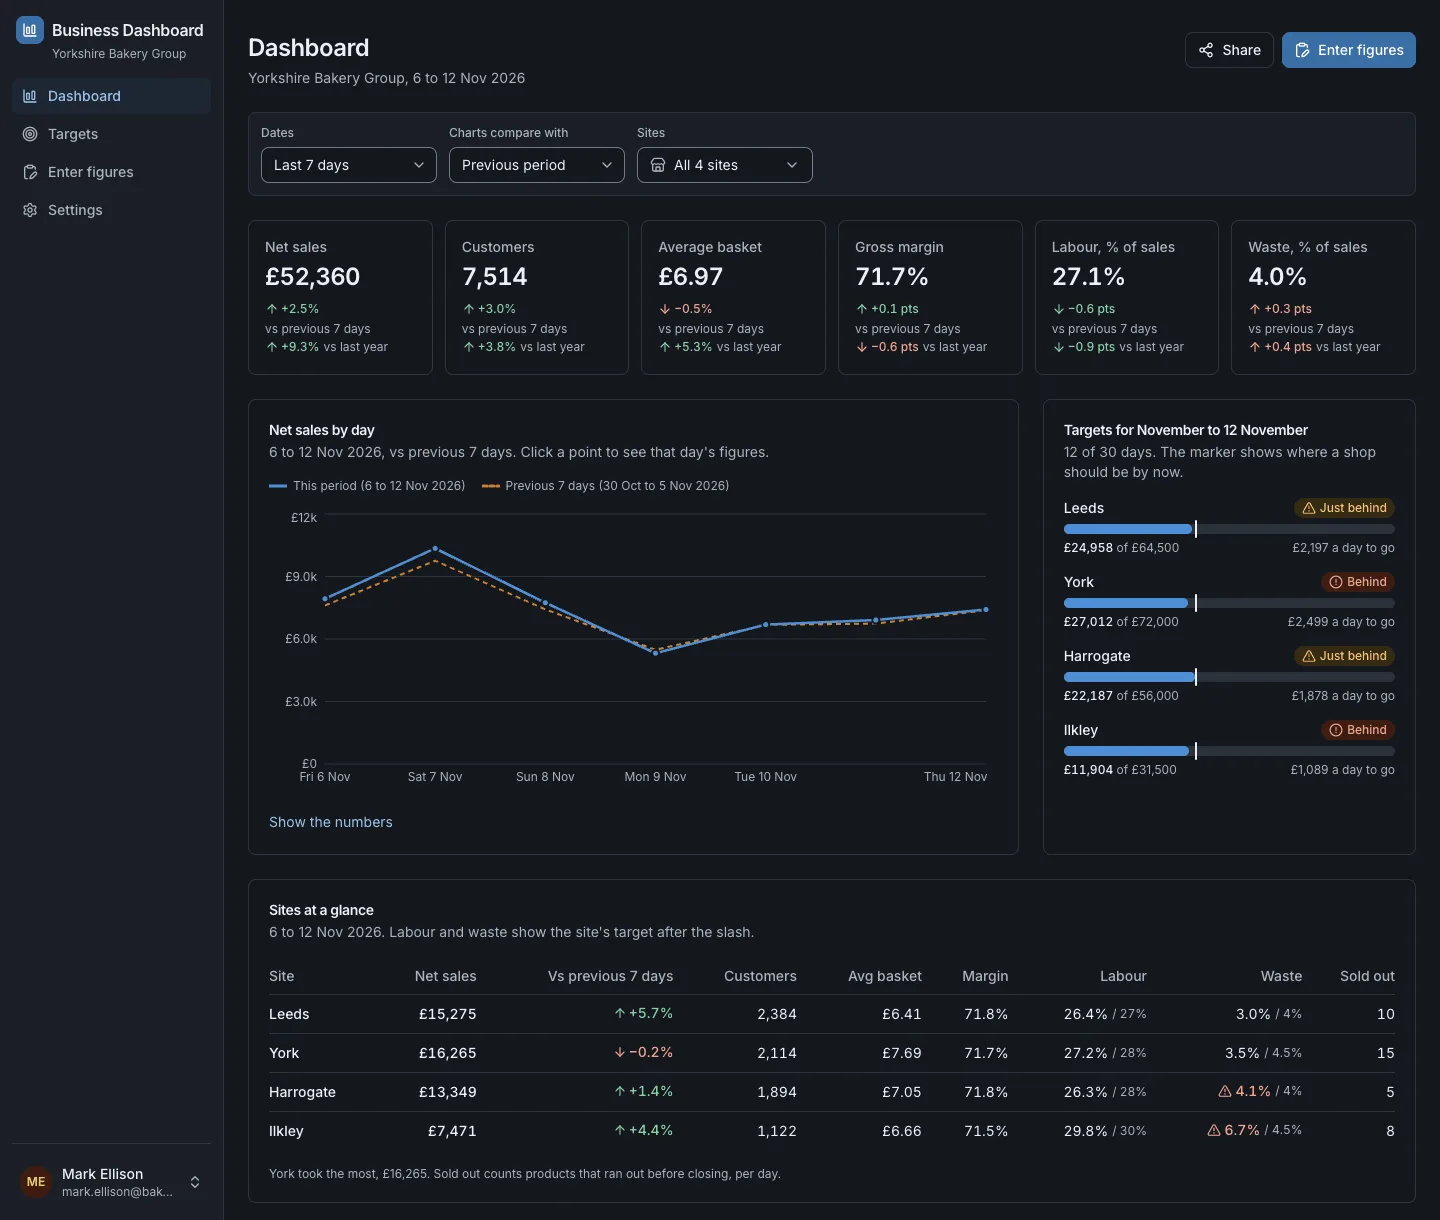
An open-source sales and KPI dashboard for shops, cafés and bakeries with more than one site, built with Next.js, TypeScript and PostgreSQL. It shows sales by day, week and month against last week and last year per site and category, gross margin, average basket, labour and waste as a share of sales, sell-outs and monthly targets, with figures from a till CSV import or a daily form, drill-down to the rows, share links and a morning email.
by Light CloudDashboards and analytics
Build a multi-site sales KPI dashboard with Next.js and PostgreSQL
Features
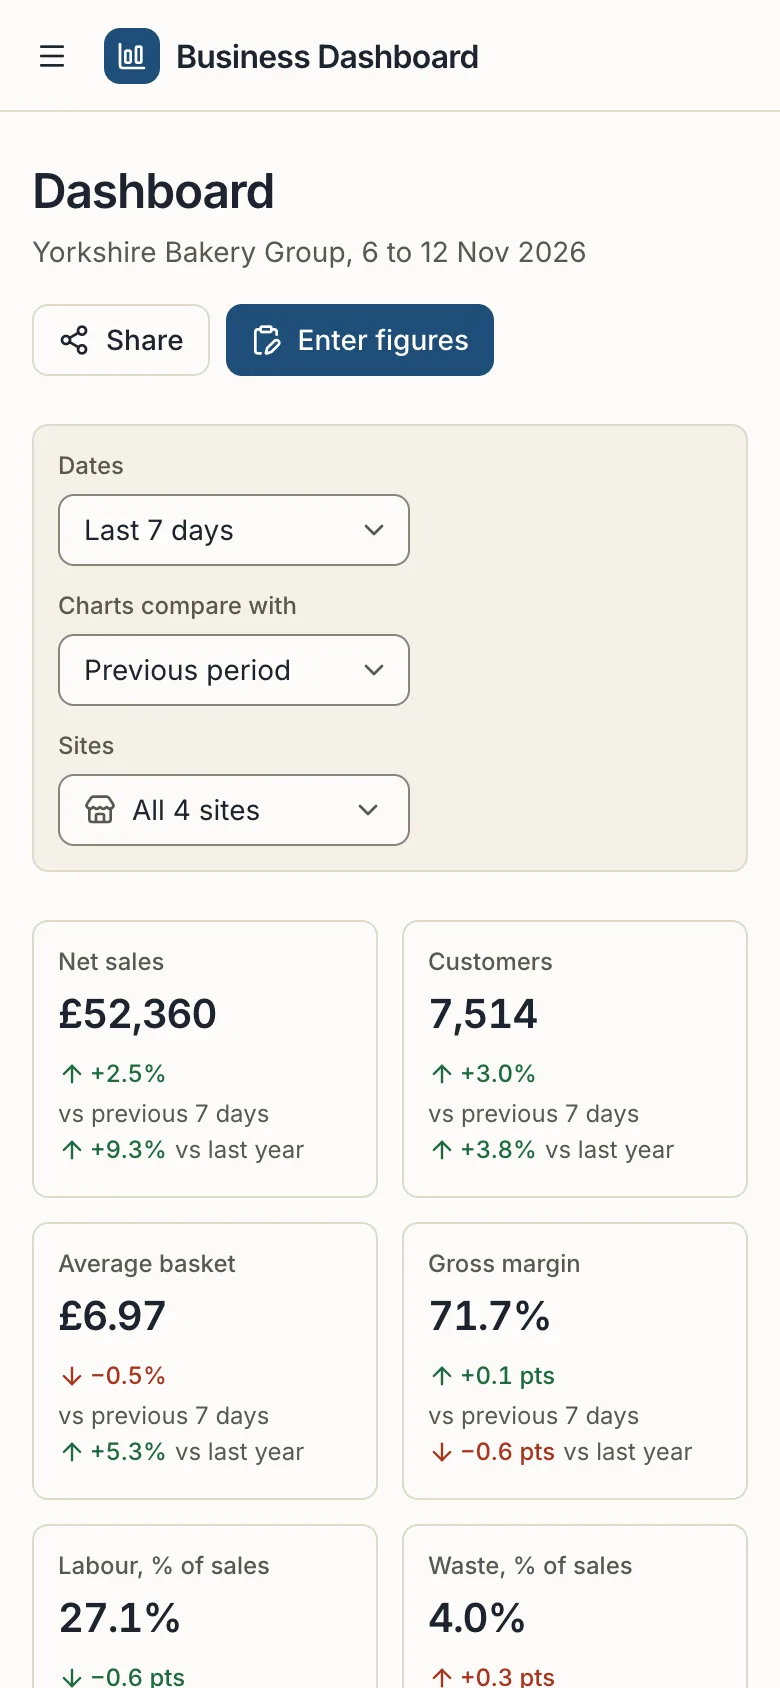
- Net sales, customers, average basket, gross margin, labour and waste with the change against the previous period and last year
- Shop-friendly dates: a day against the same weekday a week earlier, and last year as 52 weeks back so Saturdays line up
- Every chart point or bar opens the rows behind it in a sortable TanStack table with a CSV download, and every chart has a data table
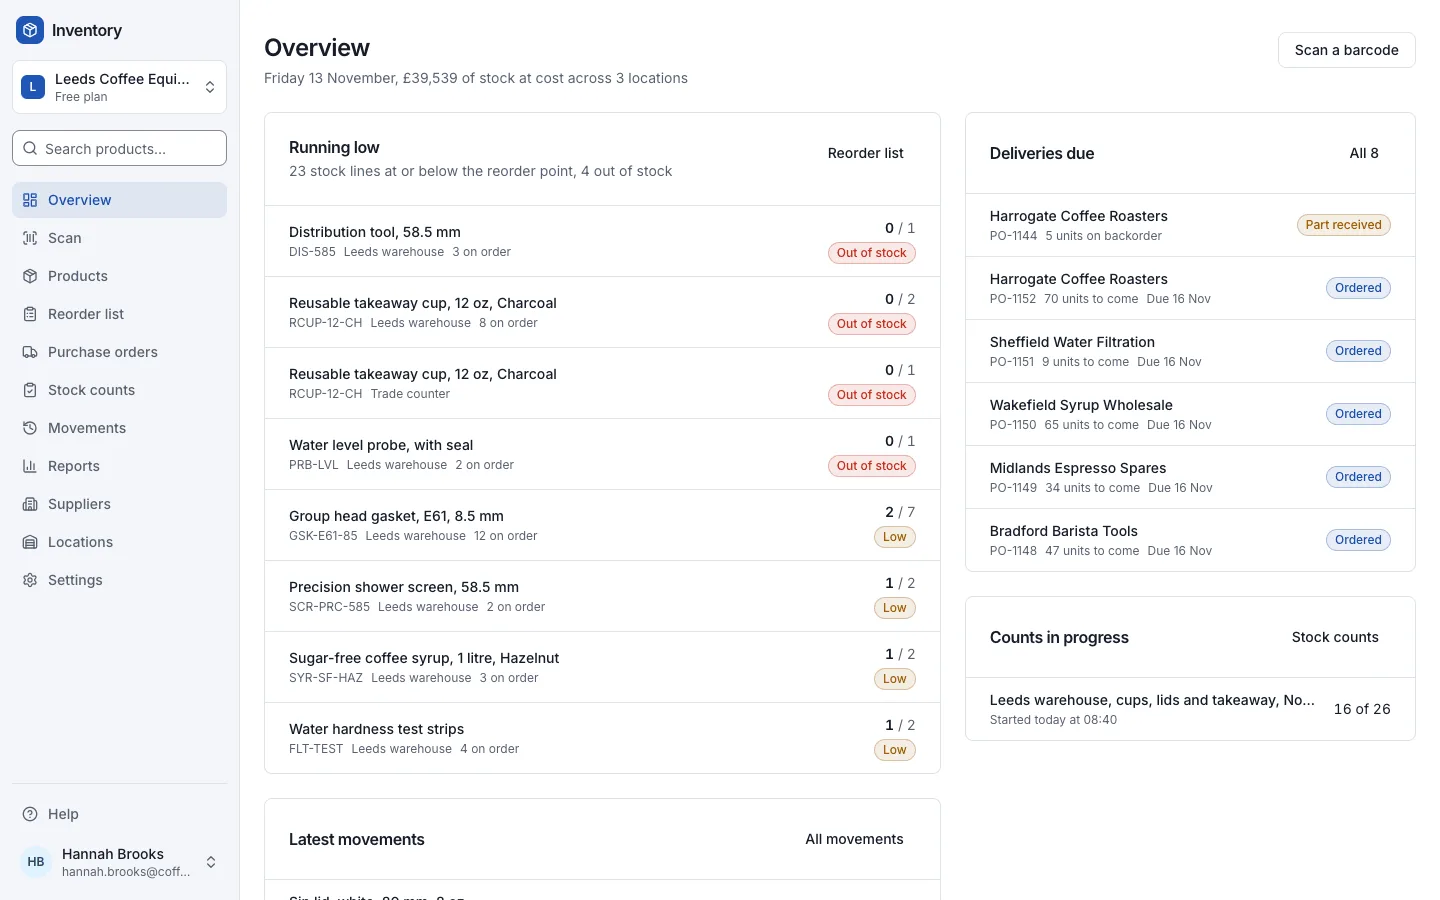
- Sites at a glance, best and slowest sellers, and what sold out before closing, how often and usually by when
- Monthly sales targets per site with labour and waste ceilings, On track or Behind status and what each remaining day has to take
- CSV import from till and rota exports with column mapping, a preview and server-side row checks, or a daily figures form
- Signed read-only share links for chosen sites that expire, and a 7am email summary per site when RESEND_API_KEY is set
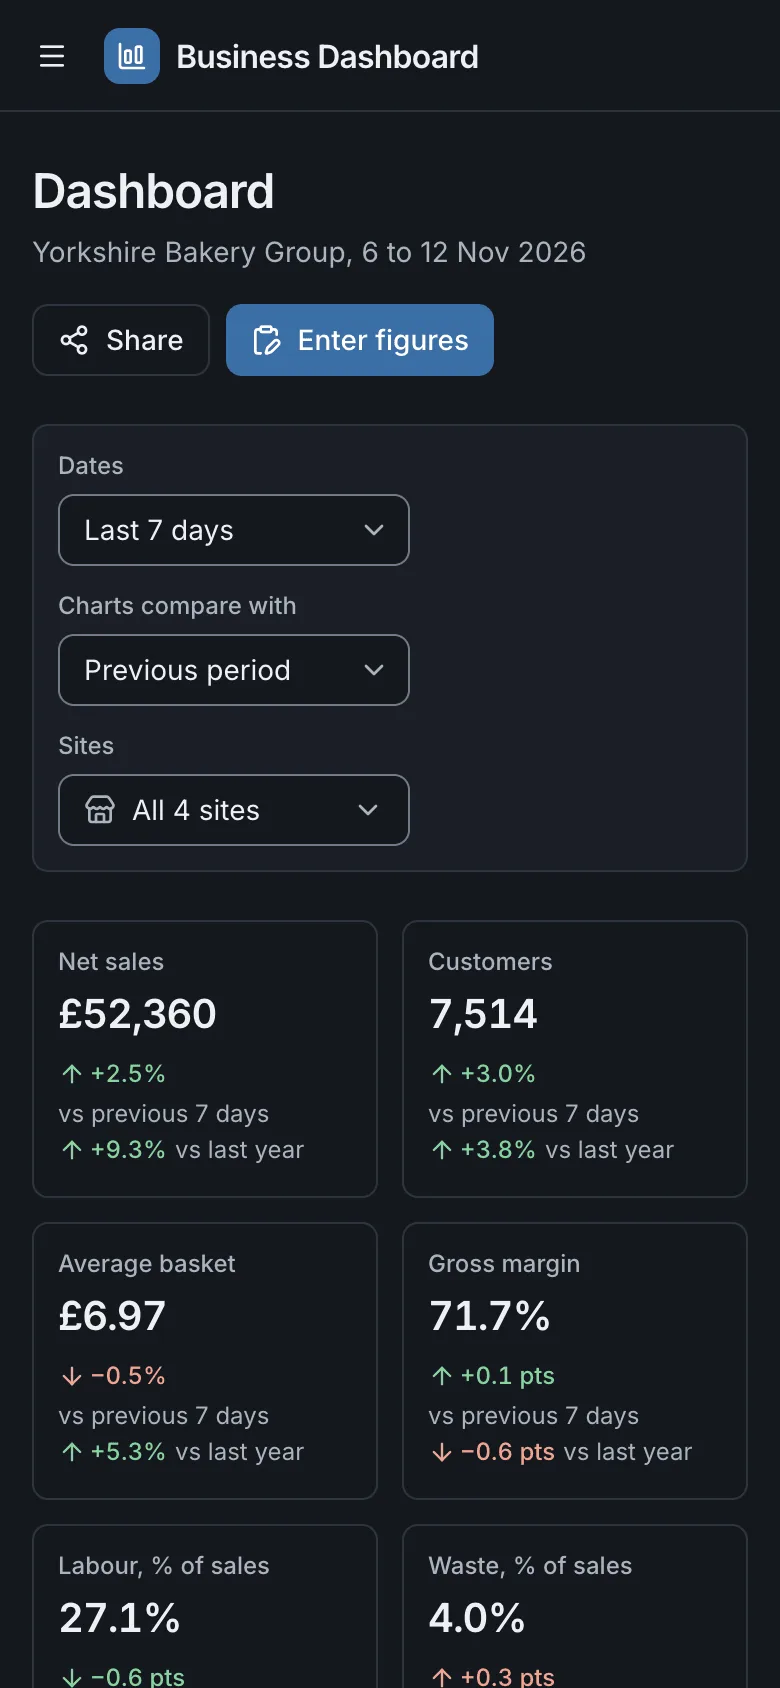
- Owner, manager and viewer roles, a four-shop bakery demo with 18 months of data removed in one click, WCAG 2.2 AA in light and dark
Tech stack

 Next.js
 React
 TypeScript
 PostgreSQL
 Tailwind CSS

 shadcn/ui
 Drizzle ORM

 Better Auth

 Resend
 TanStack Table
What you need
- A paid plan: deploying creates a PostgreSQL database, which the Free plan does not include
- To run it locally: Node.js 22.12 or newer, npm, and Docker for a local PostgreSQL
- No API keys: it starts with nothing to configure, on demo data
- Optional: RESEND_API_KEY and EMAIL_FROM for the 7am summary, invitations and password resets
- Optional: CRON_SECRET and an outside scheduler that calls POST /api/summary, so the morning email goes out on hosting that scales to zero
About
The dashboard is built on the Next.js SaaS starter's accounts, teams and design system, with the KPI maths as pure, unit-tested functions in src/lib/metrics. Money is stored in pence per site and day, labour cost as a share of sales only counts days that have both, and gross margin is measured over the lines that have a cost. The first start seeds the Yorkshire Bakery Group demo, about 72,000 rows of deterministic sales for four shops, and the first account to sign up takes it over. The morning email needs RESEND_API_KEY; on hosting that scales to zero, such as Light Cloud's default, also set CRON_SECRET and have a scheduler call POST /api/summary every 15 minutes. Rename the business and add your sites under Settings, Business, import a day from your till, then remove the demo data on the same page.
FAQ
What KPIs should a small retail or hospitality business check every day?
Net sales against the same day last week, customers and average basket, labour cost as a share of sales, waste, and what sold out early. Once a week, add gross margin and how each site is doing against its monthly target; this dashboard puts those on one screen per site.
How do I import sales from my till or EPOS system into a dashboard?
Export sales by product (date, site, product, category, quantity, net sales and cost if the till has it) as CSV and import it under Enter figures, Import a CSV file. Match the columns once and every row is checked before anything is saved; dates are read day first, as UK tills write them.
How is labour cost as a percentage of sales worked out?
Wages for the period, including employer National Insurance and pension, divided by net sales without VAT. Only days that have both a labour cost and sales count, so a missing rota never makes a shop look cheap to run.
Can I share a sales dashboard without giving someone an account?
Yes. Settings, Share links makes a signed, read-only link for one or more sites that expires after 7, 30 or 90 days or when you turn it off. The person can change the dates and open the rows behind each chart, but cannot enter figures or see the team.
How do I get the daily email summary on hosting that scales to zero?
Set RESEND_API_KEY so the app can send email, then set CRON_SECRET and have a scheduler call POST /api/summary with it every 15 minutes. A server that stays running checks every 10 minutes on its own, and each person gets each summary once however often it is called.